Guia do usuário
Visual graphs
Wire nodes into a recipe — numbers, lists, points and the tools' own commands — see what it would make as a ghost, and bake it in one undo step.
What a graph is
A graph is a recipe drawn as boxes and wires. Each box is a node: a number, a range of numbers, a point, a sum, or one of the tools themselves (Wall, Floor, Column… every command of your edition). Wires carry what one node gives into another. Lapin works the graph out as you change it and shows what it would make as a ghost in the plans and the 3D view; nothing is made until you press Bake, and then it is one undo step.
Graphs need no programming and no Python: Lapin's engine evaluates them, in the desktop app and in Lapin for the browser alike. They are kept with the project.
The Graphs panel
Open View → Graphs. The panel opens beside the view: drag the line between them to share the width. On the desktop, drag the Graphs tab out of the window (or press the window button beside the tabs) to give the panel a window of its own, to float or to put on a second screen; the ghost still shows in the main window.
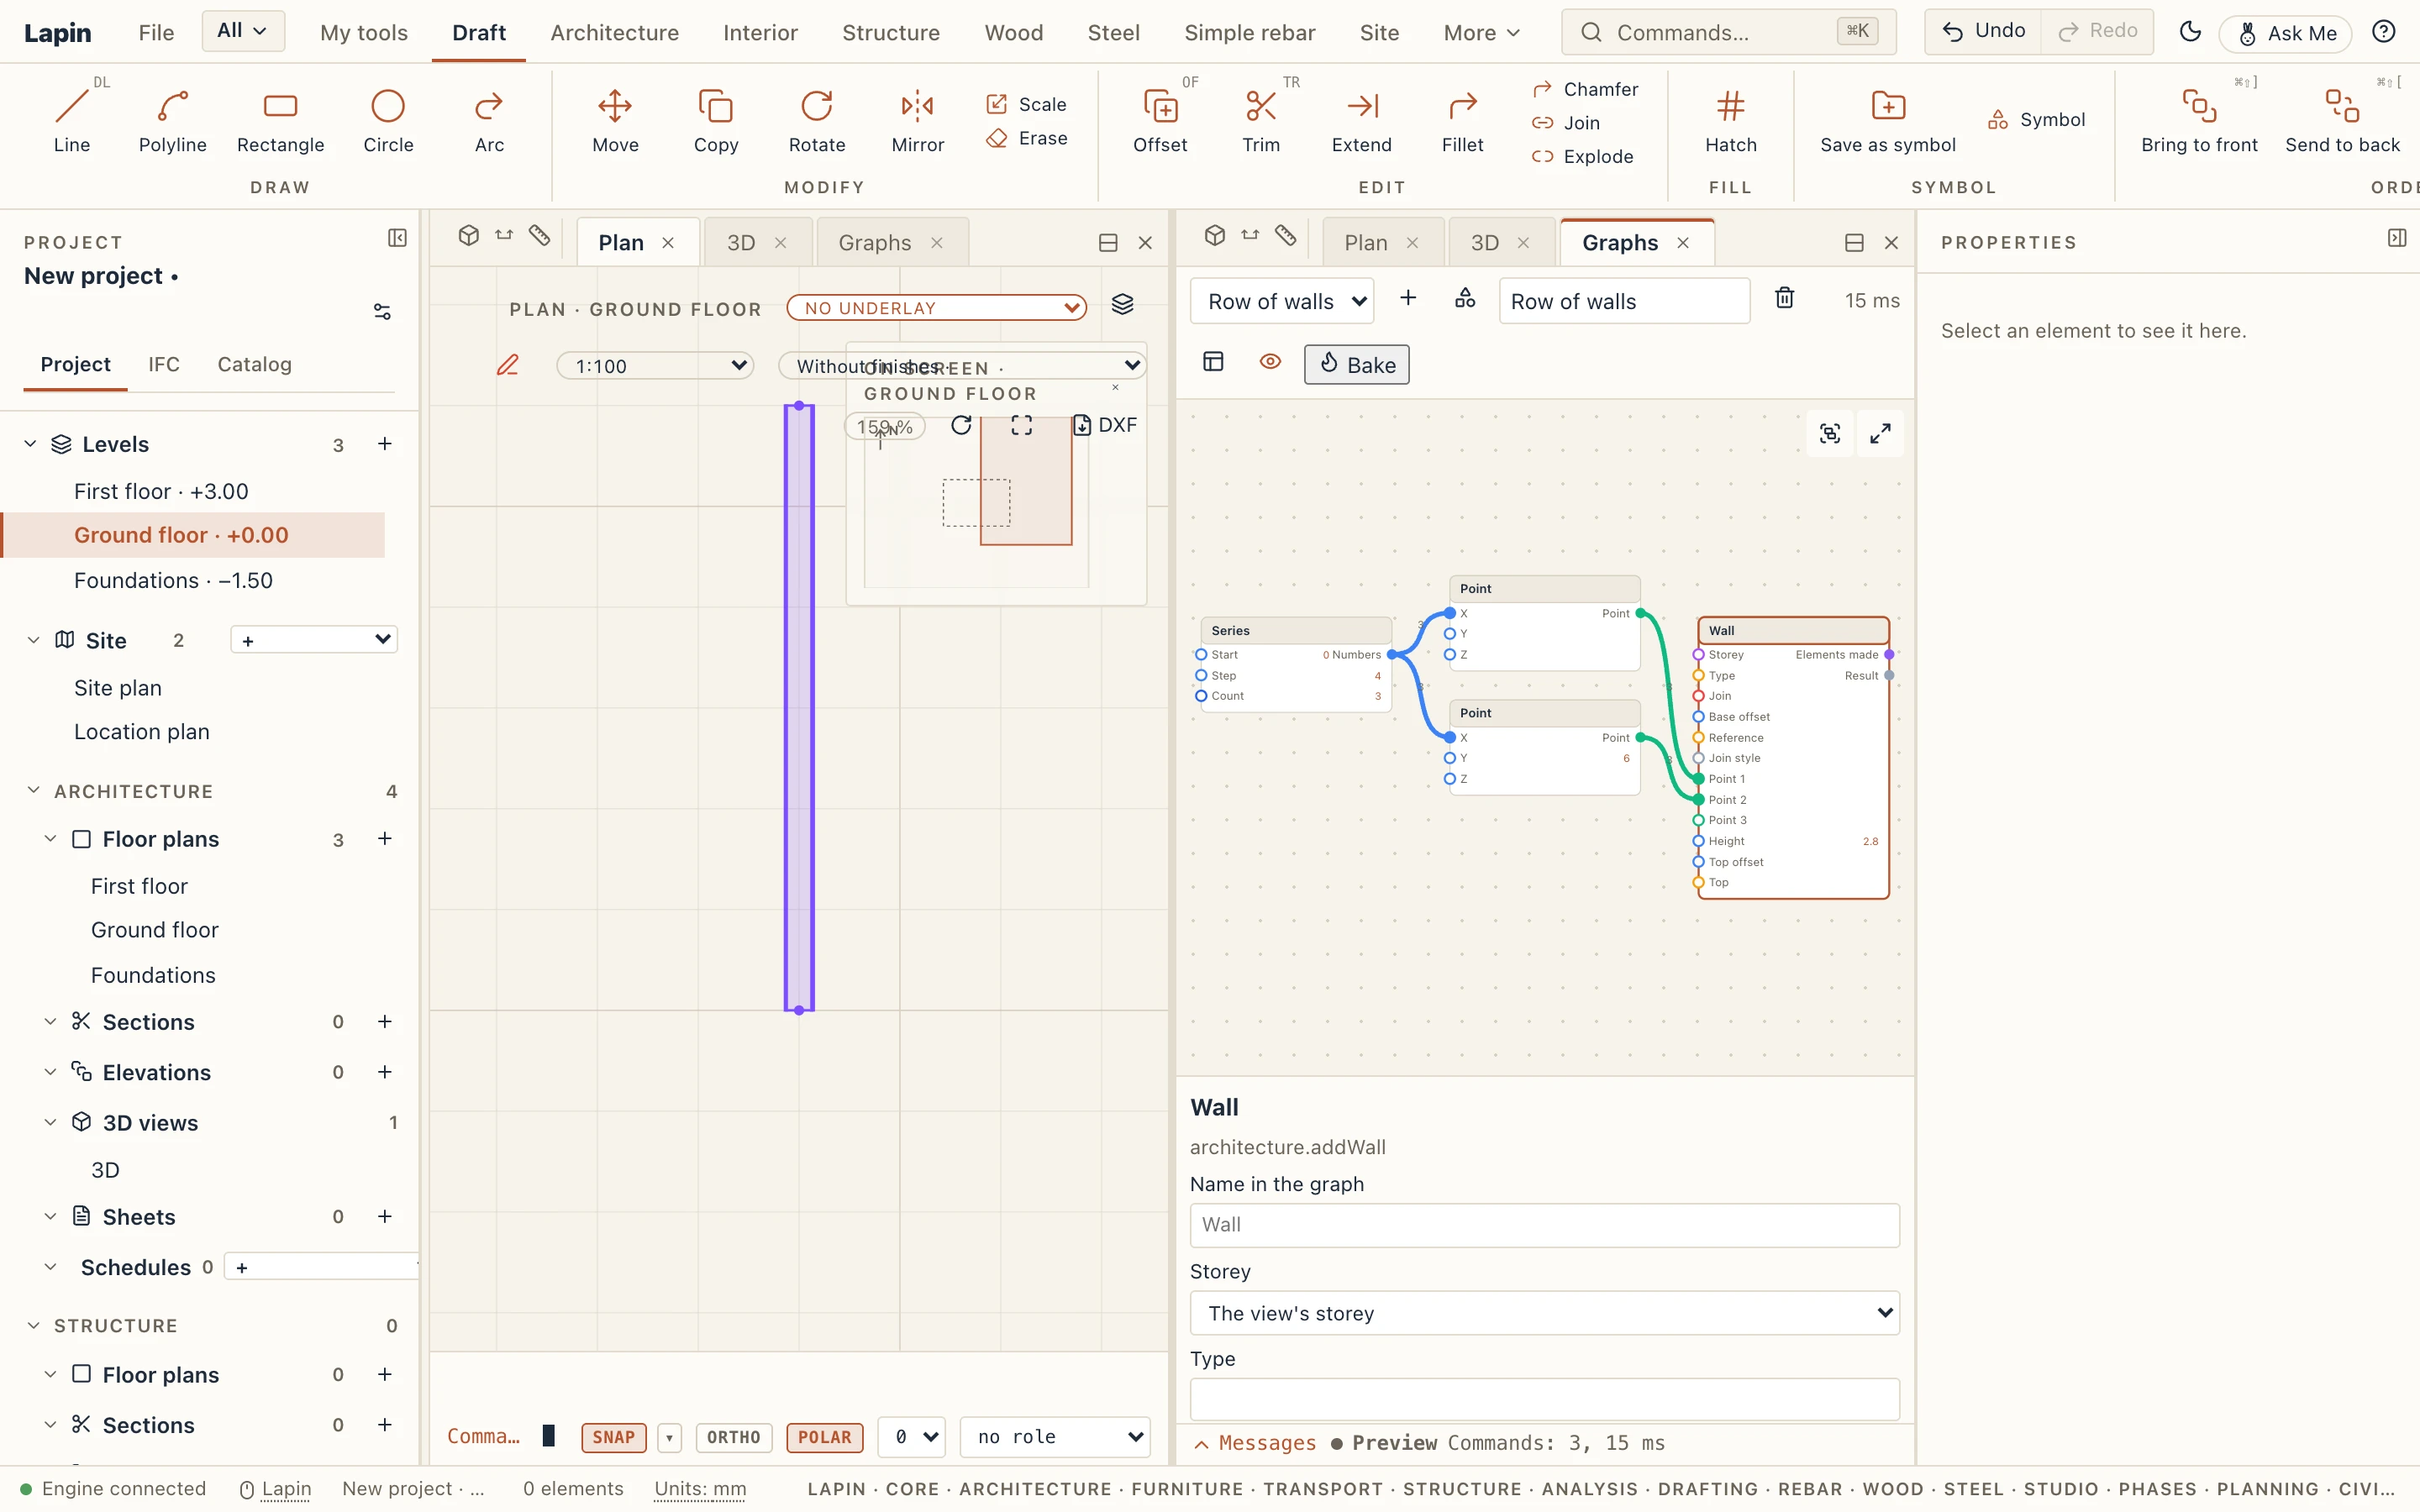
- Above: the project's graphs, New graph, the graph's name (type to rename it), Delete graph, the eye that shows or hides the ghost, and Bake.
- The canvas: double-click an empty place to add a node: type a few letters (
wall,range,point) and press Enter. Drag from an output (right side of a node) to an input (left side) to wire them. Drag a node by its title; Shift-click to select more, or drag a box round them; Delete takes them out. The wheel zooms, the middle button (or Space and drag) moves the canvas. The graph fits the canvas when it opens and as the panel is resized, until you zoom or move the canvas yourself; the Fit button in the canvas's corner (or F, or Home) fits it again. Numbers are written with a decimal point, as the nodes show them; a decimal comma typed is read too. - The inspector, on the right: the selected node's inputs that have no wire (type a value), what it gives, and why it failed if it did.
Every change is one undo step: Ctrl+Z undoes a node added, moved or wired as it undoes a wall.
Ports and lists
Ports are coloured by what they carry: numbers blue, texts amber, points green, elements purple, lists grey. A wire between kinds that do not meet is refused, with why.
There are no data trees. A list wired into an input that takes one value runs the node once for each item: a Series of three numbers into a Point's X gives three points, and three points into a Wall's Start give three walls. Several lists run side by side; a shorter list repeats its last item. A wire carrying a list is drawn thicker, with the number of items on it. Some inputs take the whole list instead (Count, Sum, Item, Polyline). A tool's list input (the elements a Pad footings under columns works on, a floor's points) takes the whole list in one run; a list of lists runs it once for each list, and so does a list of polylines wired into a floor's points: one floor for each outline.
A tool's node takes the same inputs as its command: a Wall has Start and End points, a height, a storey, a type. Its outputs are Elements made and Result (what the command answered).
List nodes
Besides Range, Series, Count, Item, Reverse, Flatten, Sum, Smallest and largest and Filter, the Lists group has:
- List: a list you type, its items between semicolons or each on a line of its own:
3; 4,5; 6. A decimal comma or point is fine. Kind Auto gives numbers when every item is a number, else texts; Numbers says which item is not one; Texts keeps everything as text. - Join lists: the lists wired into A, B, C and D one after the other. A single value counts as a list of one, so it also gathers a few values into a list; an input left empty is left out.
- Sort: numbers by size, texts alphabetically, with the numbers in them by size (W2 before W10, capitals or not). Wire another list into By to sort by its values, place for place: the walls of a class by their height (Property
heightinto By). Descending turns it round. Equal values keep their order; an empty item goes last. Order says where each item was, from 0. - Part of a list: Count items from Start (from 0). A negative start counts from the end; no count takes everything to the end. The first three: start 0, count 3; the last three: start -3.
- Unique: each value once, in the order first seen, and How many times each was there. Numbers a billionth apart or less are the same, points too; texts are compared as written (capitals count), and the number 1 is not the text „1”.
- Every with every: every pair of an item of A and an item of B. Its outputs A and B are as long as the pairs (A's items each repeated, B's over and over), so the next node, fed both, runs once for every pair: a List of X values and one of Y values into Every with every, then into a Point, give a point at every crossing. At most 10,000 pairs.
Geometry nodes
The Geometry group makes points and simple shapes: Point, Point's coordinates, Move point, Distance, Divide line, Grid of points, Points on a circle, Line, Polyline, Rectangle and Corners, and these, which change points and polylines:
- Rotate: points or polylines turned about the vertical through the Centre by the Angle in degrees, anticlockwise (no centre: the origin). A list of angles and one outline give one turned outline for each angle; a list of outlines and a list of angles turn each outline by its own angle.
- Scale: points or polylines made larger or smaller about the Centre by the Factor (2 doubles them, 0.5 halves them; no centre: the origin). A Z factor, when given, scales the heights apart from the plan.
- Centre: the middle of the box round the points or polylines given, all of them together: a rectangle's centre, the point to turn or scale it about.
- Points on a circle has a Start angle in degrees: where its first point is, counted anticlockwise from X (0, the default, puts it along X).
A twisted tower
The classic: floors from a series, each turned a little more than the one below, tapering if you like, with sliders for the floors, their height, the twist and the size.
- Five input nodes: Whole number „Floors” (12), Number „Floor height” (3.2, metres), Number „Total twist” (90, degrees), Number „Width” (24, metres), Number „Taper” (0.7: the top floor's size, the bottom's being 1).
- Series „Levels”: Start ← Floor height, Step ← Floor height, Count ← a Formula
a - 1of Floors. Then the New storey tool's node: Elevation ← Levels, Height ← Floor height. It makes a storey at each level above the ground. A new project already has its storey at level 0, which carries the first floor: a Storeys node, a Compare (its levels=0) and a Filter pick it out, and Join lists puts it before the new storeys. - Rectangle: Width and Depth ← Width. Centre ← the rectangle's Outline: the point the floors turn about.
- The turns: a Formula
a / max(b - 1, 1), a ← Total twist, b ← Floors (the top floor turns the whole twist); a Series „Turns”: Start 0, Step ← Formula, Count ← Floors. - The sizes: a Formula
(a - 1) / max(b - 1, 1), a ← Taper, b ← Floors; a Series „Sizes”: Start 1, Step ← Formula, Count ← Floors. - Scale: Points or polyline ← the rectangle's Outline, Centre ← Centre, Factor ← Sizes. Then Rotate: Points or polyline ← Scale, Centre ← Centre, Angle ← Turns: one outline per floor, each turned and scaled.
- The Floor tool's node: Points ← Rotate, Storey ← the joined storeys. One floor on each storey, the first on the ground storey.
- Columns, if you like: a Scale with Factor 0.85 of the turned outlines about the Centre, its Corners' Points into a Column's Point, Storey ← the joined storeys, Rotation ← Turns.
Make it a tool (Show in My tools), give the five inputs a least and a most, and the palette's sliders turn and taper the tower as you drag them; Bake makes the storeys, floors and columns in one undo step. Thirty floors with their columns preview in about a third of a second.
Examples
New from example…, beside New graph (and on the empty panel), lists the graphs that come with Lapin, each with a line about what it makes. Pick one and a copy is saved into the project, with a name not taken yet, and opens on the canvas, fitted: change it, press Bake, or open its palette. The copy is yours; the example itself never changes, and the project is the host's like every graph.
- Twisted tower: the one above, ready: floors, height, twist, width and taper as sliders; it makes the storeys, a floor on each and four columns on each floor, the first floor on the project's ground storey.
- Columns on a grid: a Grid of points into a Column; how many columns each way and their spacing as sliders.
- Walls round a rectangle: a Rectangle's Corners into a Wall's Start and End; width and depth as sliders.
Reading the model
The Model group reads the elements you pick (Elements picked and Use the selection, or Elements of a class) as references. Each node takes one element or a list of them; an element of the wrong kind fails on its own item and says why, the others are read. The model is read as it is now: move a wall and the preview of what the graph makes from it moves too. Curves come as points by the same rule as every curve in Lapin (no chord more than a millimetre off).
- Axis: the axis of a wall (a curved one too), a beam, a strip footing or a railing, or every axis of a grid, as a polyline, with its Start and End. A wall's at its base, a beam's at its top.
- Outline: the closed outline of a floor, a room, a roof or a site zone (a planting), at its level, and its Corners.
- Location: where a column, a pad footing, a piece of furniture, a door or a window stands, and its Rotation in degrees. A door or a window is on its wall's axis, at its sill.
- Bounding box: the box round any element's body as Lapin builds it: its lowest and highest corners, its centre, its size along X and Y and its height.
- Drafting geometry: a line, polyline, rectangle, arc or circle drawn with the drafting tools, or the linework of an imported DXF, in the model: on its view's level (a plan's at its storey's level), arcs and circles as points. It gives the Line, its Points, Start, End and the Centre of an arc or a circle. Select the shapes in the plan, press Use the selection on an Elements picked node, and wire it in: a drafted polyline into Corners, then its segment starts and ends into a Wall, makes a wall along each side; a drafted line into Divide line, then into a Column, makes columns at its division points.
A graph as a tool
A graph can be a tool of its own: its inputs become the fields of a small palette that works it out and bakes it without the canvas, in the desktop app and in Lapin for the browser alike.
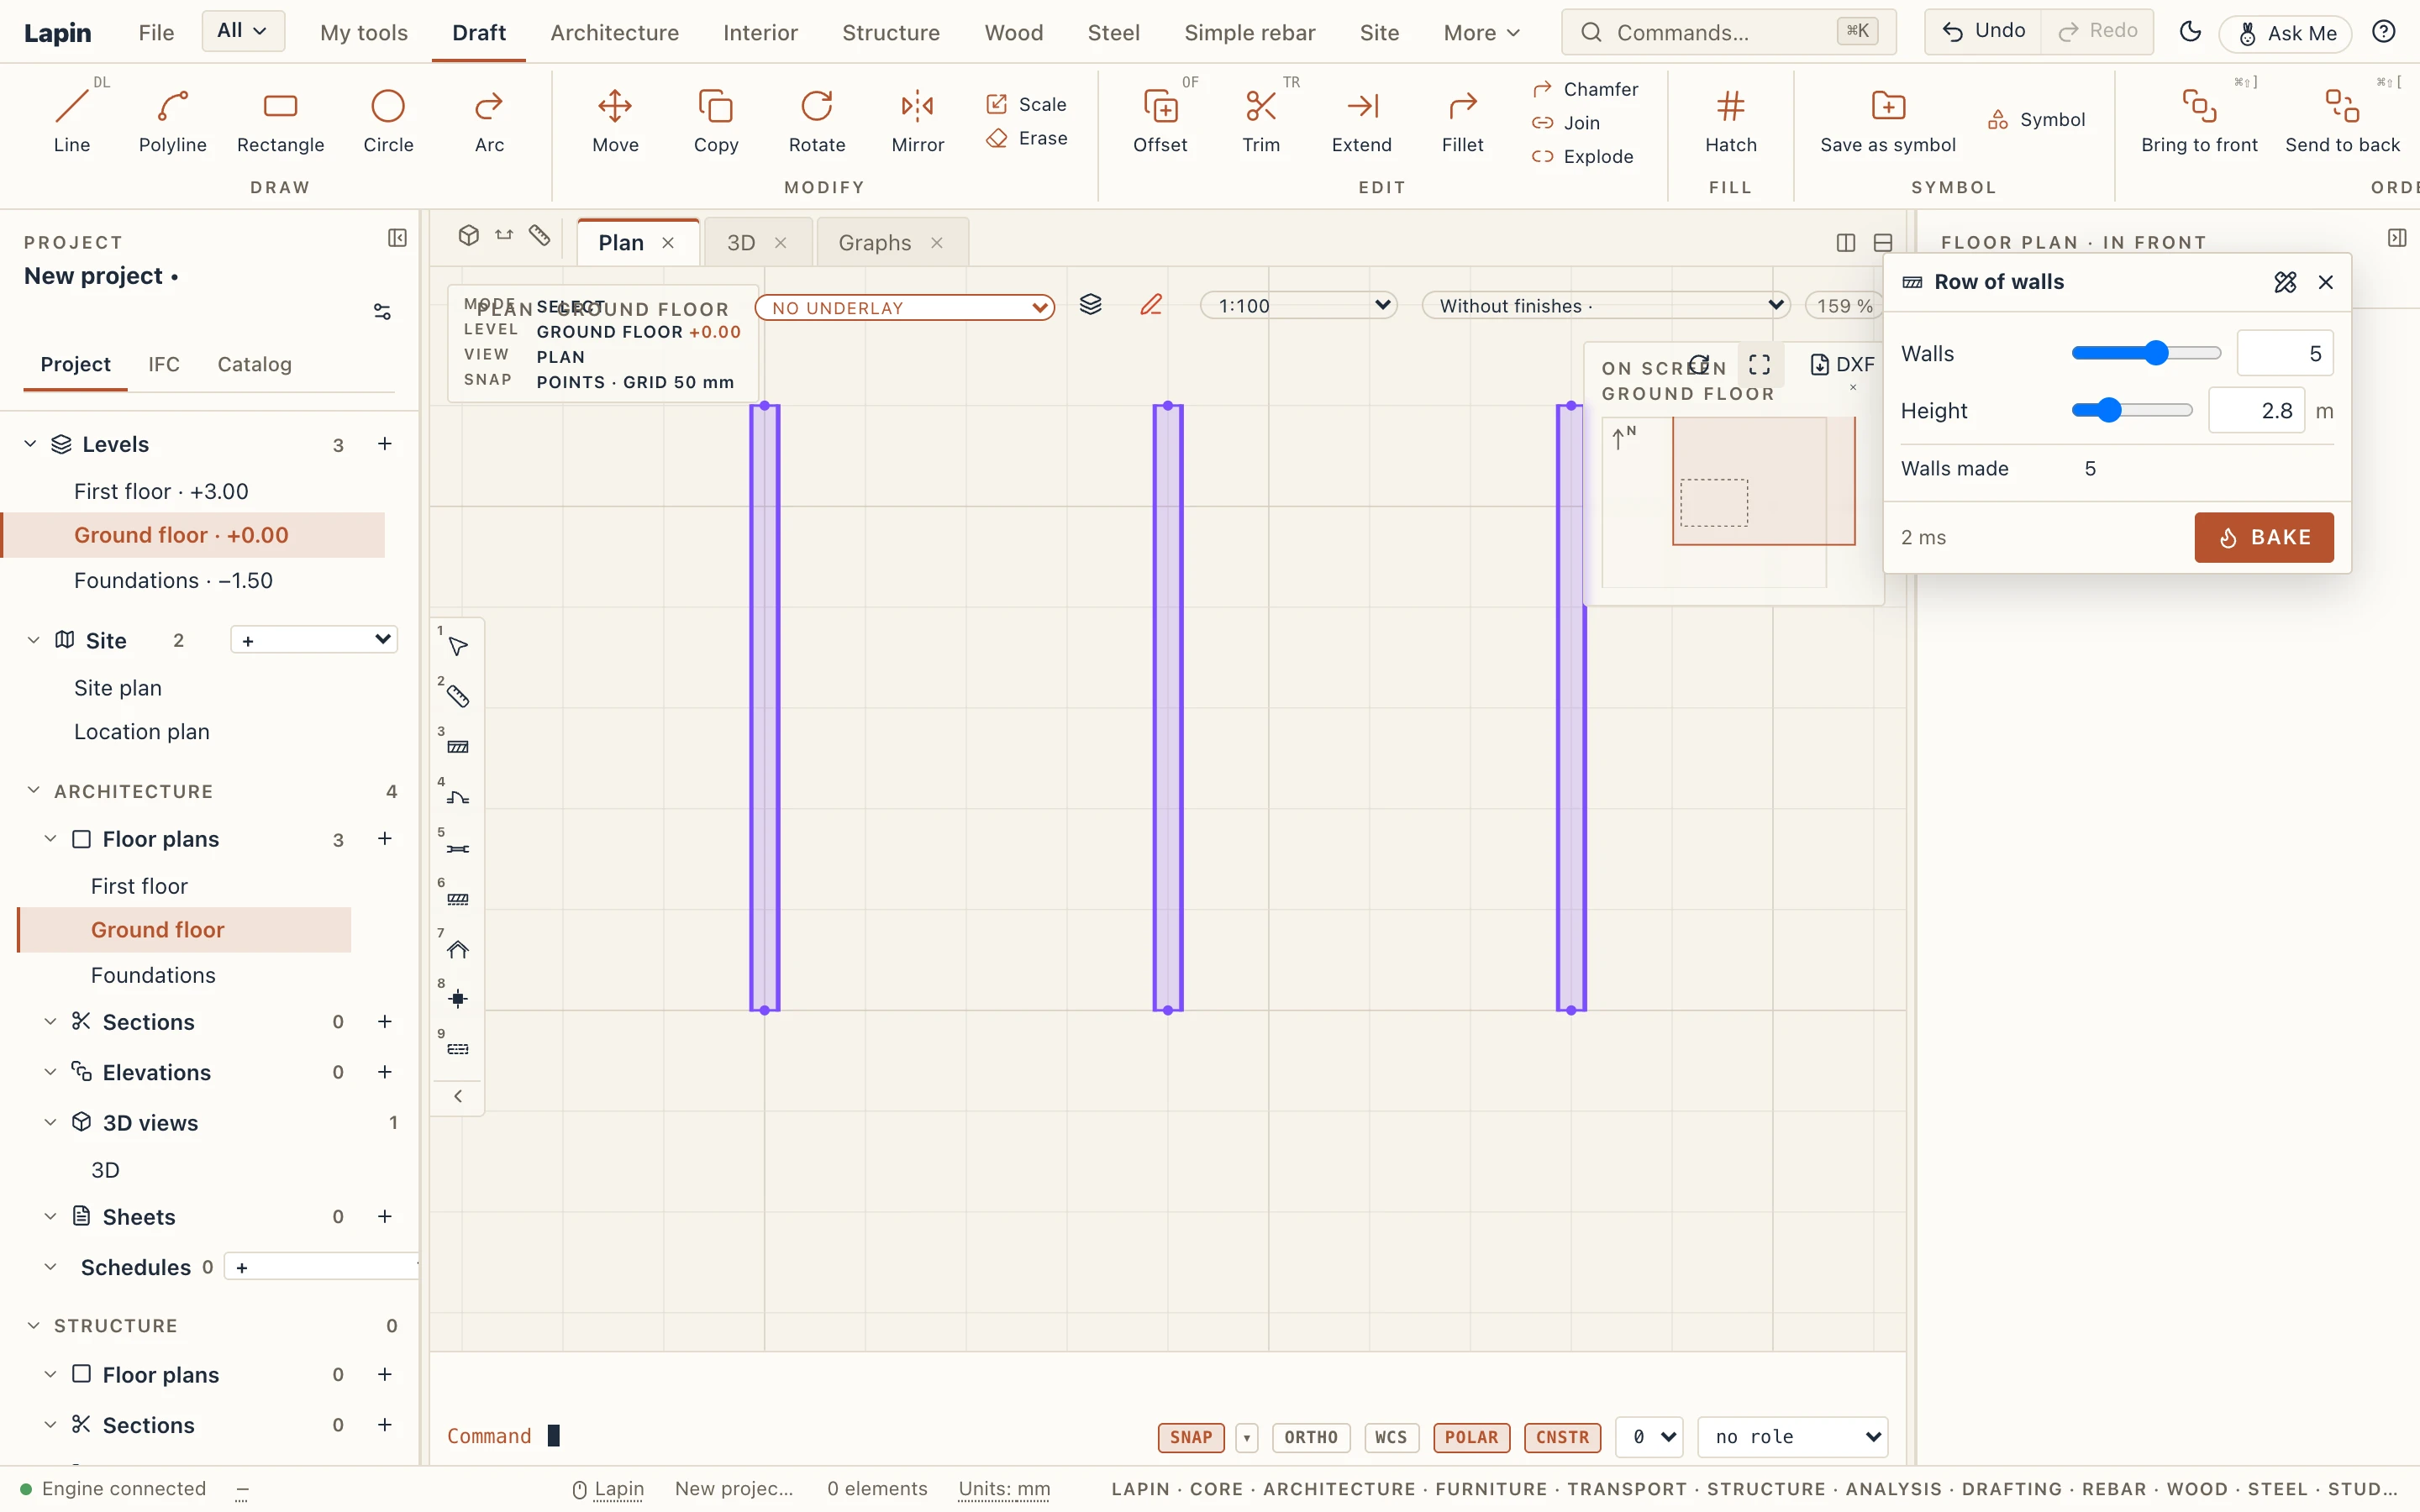
Make it a tool: click an empty place of the canvas, and under The graph as a tool in the inspector tick Show in My tools. Its button goes into My tools, in the group Graphs unless you name another, with the name you give it (the graph's, else), an icon (
wall,grid,star… or a letter) and a tooltip. The palette button above the canvas opens the palette too.The fields are the graph's input nodes: Number (with its unit, metres or degrees; with a Least and a Most it gets a slider), Whole number, Text, Yes or no, Choice, Elements picked (with Use selection), Storey (the view's, unless one is chosen) and A type (a wall type, a floor type… for a tool's Type). Select an input node and set, under In the palette, whether it shows there, its label, its Order (those without one follow, top to bottom as on the canvas), and a number's least, most and step.
What it gives: every Watch node shows its value in the palette, under the fields; tick Show its values in the palette on any other node (a Count of the walls made, a Sum of lengths) to show it too. A list shows its first items and how many in all, a list of lists as a small table.
Using it: change a field and the ghost follows at once, the model untouched. Let go of it (release the slider, press Enter, tick a box, choose) and the value is written into the graph: one undo step, and the canvas shows it too. Bake makes what the ghost shows, in one undo step.
Palette values, under The graph as a tool, says whose the values are:
- Shared (the default): what you let go of in the palette is written into the graph, as above. The values belong to the graph, kept with the project: a colleague opening it gets the same tool, the same fields and the values last used.
- Each user's own: the graph's values are only the defaults. What you change in the palette is kept on your computer, for this project and this graph, and never written into the graph; a colleague sees the graph's values, or their own. A small dot beside a field marks a value of yours that differs from the graph's. The ghost and Bake use your values, and Bake makes only the elements: the graph stays as it was, and the undo step is still "Bake graph". Reset to the graph's values forgets yours; Save as the graph's values writes them into the graph for everyone, in one undo step. A value of yours that no longer fits (its input node deleted or changed, a choice no longer offered, a number outside its least and most, a storey or a type gone) gives way to the graph's.
In a shared session the guests get no palette, as they get no graph.
Groups
Select some nodes and press G (or the group button in the canvas's corner) to collapse them into one node: a group. Its inputs are the wires that came into the nodes from outside, its outputs those that left them; the graph works out the same. Select the group and press Expand the group in the inspector to have its nodes back, where the group stands. The input nodes inside a group are still fields of the palette.
Errors
A node that fails turns red and says why in the inspector (and when hovered): a wall of no length, a division by zero. The nodes after it say which input has nothing; the rest of the graph is still worked out. When only some items of a list fail, the node turns amber and says how many.
Messages
Under the canvas, a strip called Messages lists what the last evaluation found: each node that failed or warned, with its name and the reason; nodes left with nothing to work on because an input before them failed; the limits the graph reached; and one line with how many commands it ran and how long it took. Open it with its arrow, filter by Errors, Warnings or All, copy the rows as plain text, or clear them. Click a row to select its node and bring it to the middle of the canvas. Each evaluation replaces the rows of the one before, so editing never floods the list; Bake adds its own row, how many elements it made in one undo step, or why it refused. Collapsed, the strip is one line with the latest message and the number of errors. Its height, and whether it is open, are remembered. Guests have no Graphs panel, so nothing changes for them.
Bake
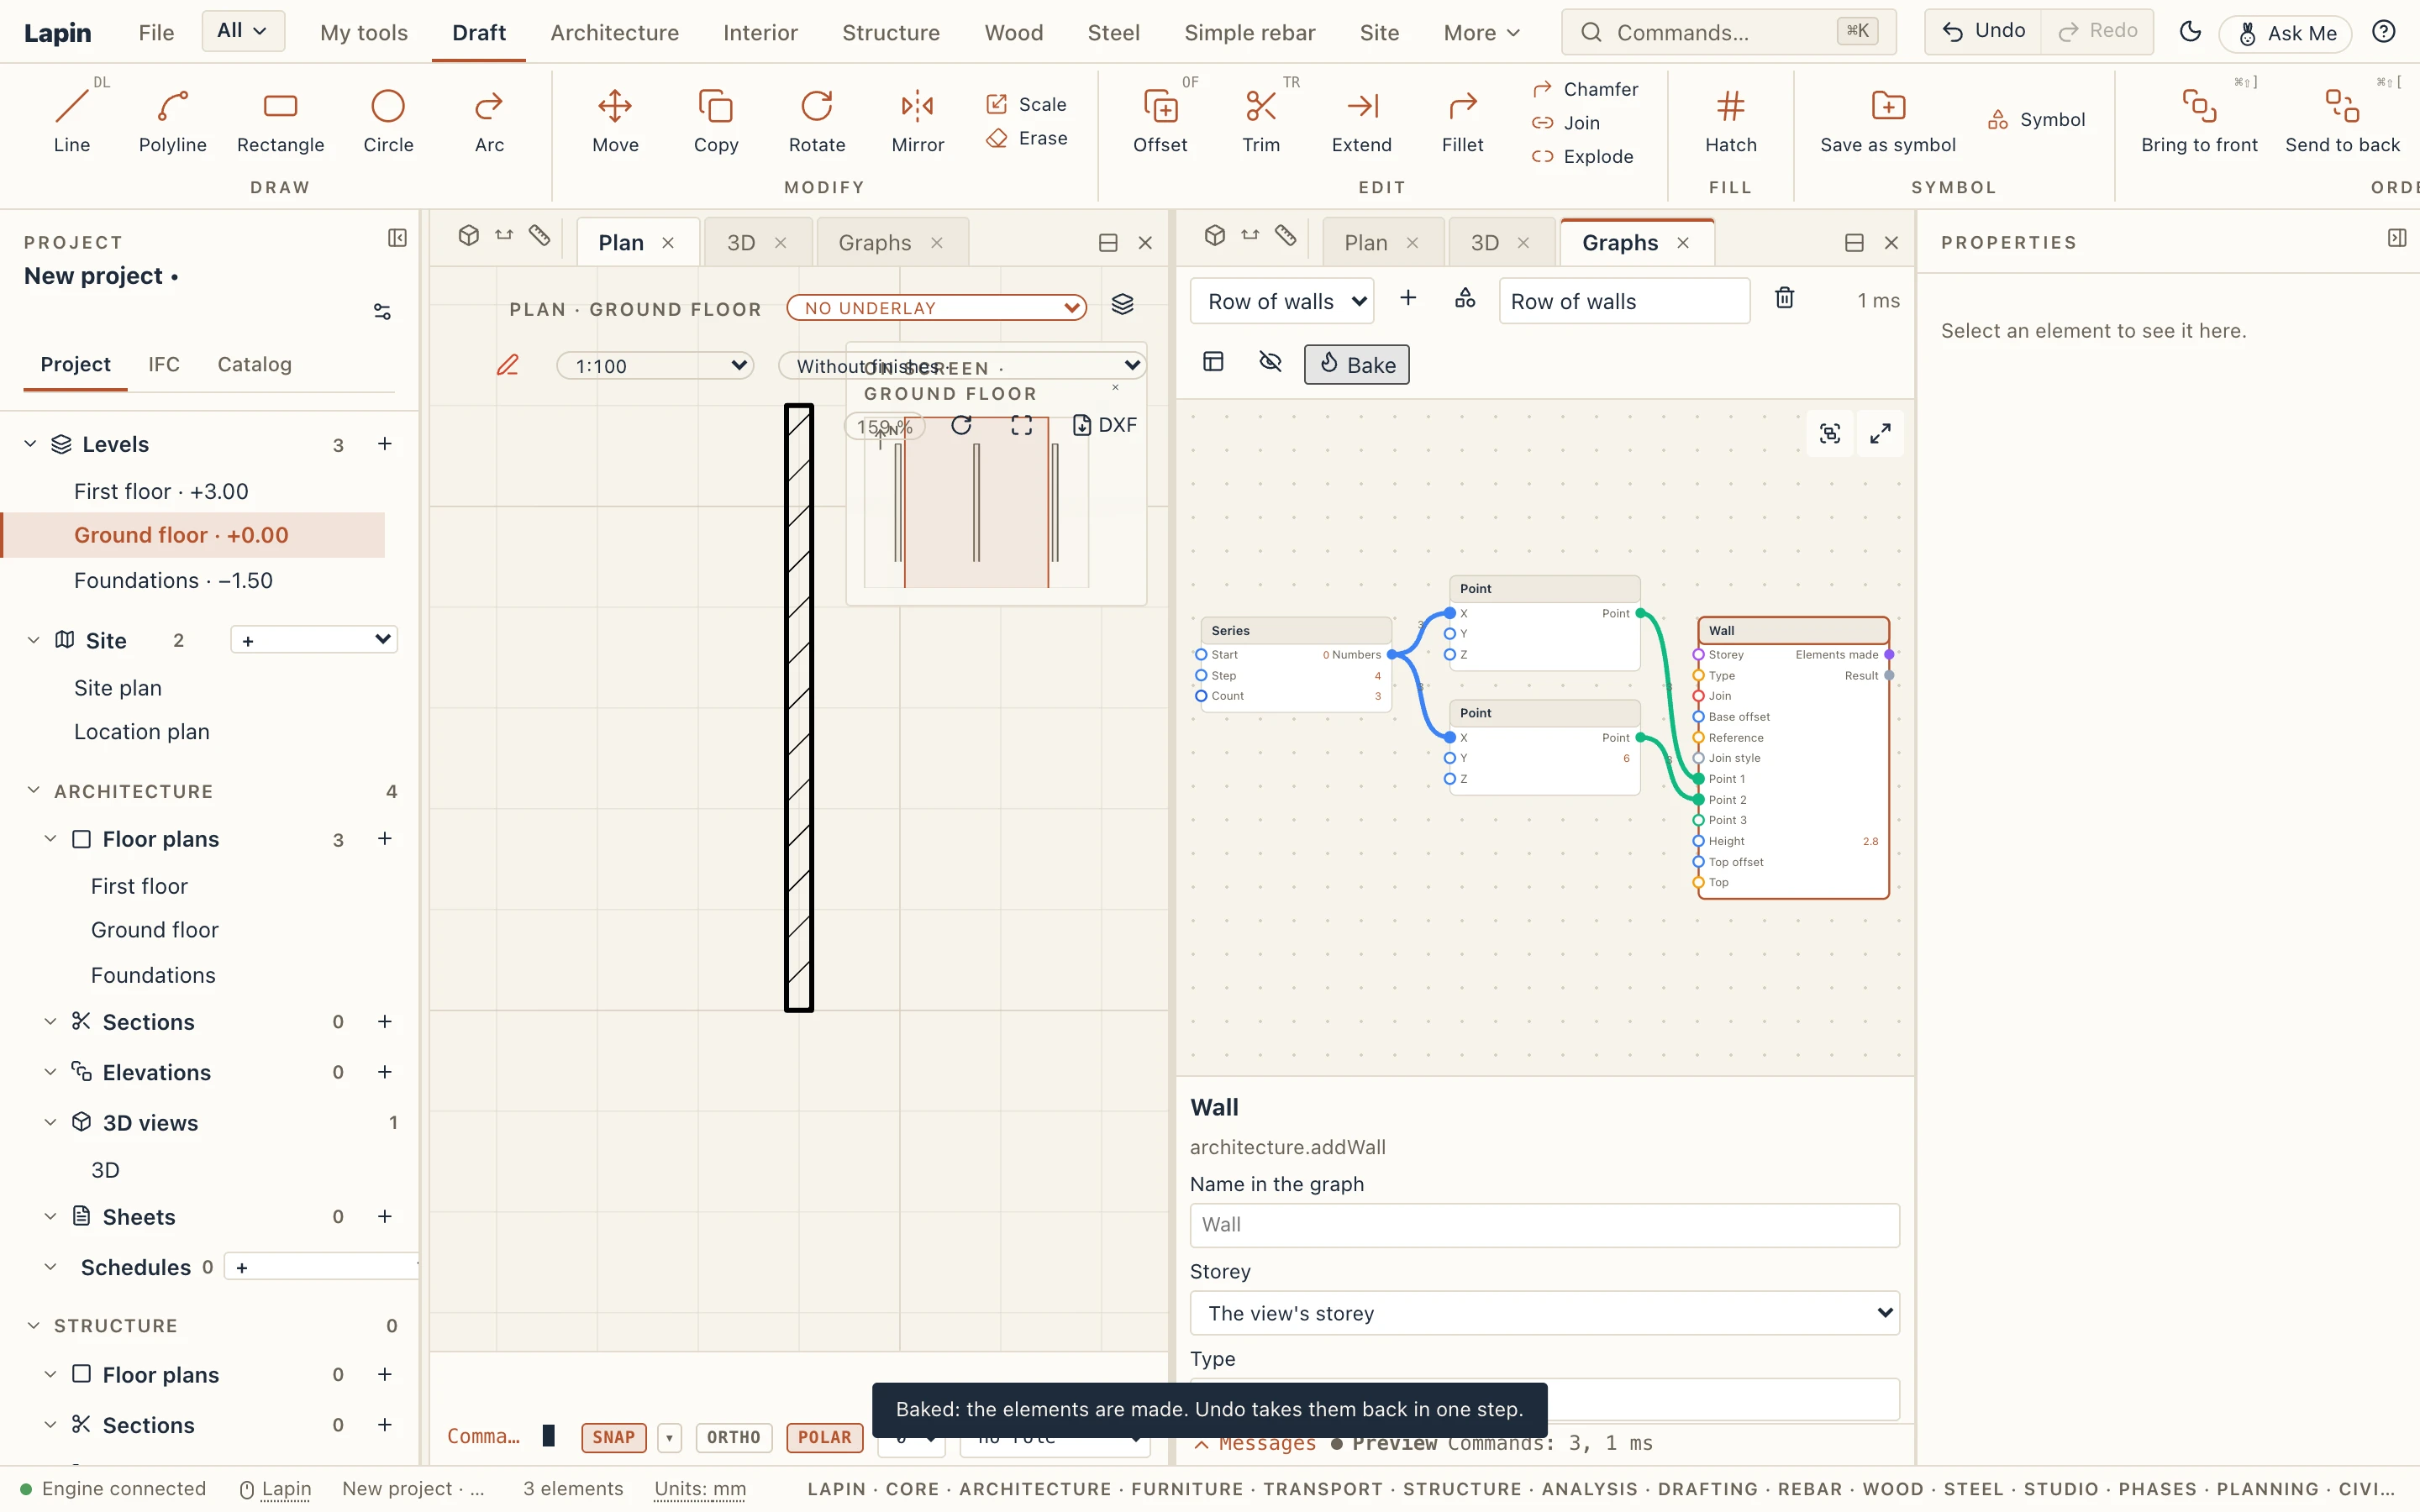
Bake makes what the ghost shows, in one undo step named Bake graph. If any of the tools' nodes fails, nothing is made and Lapin says which node failed. Once baked, the ghost is hidden (the eye shows it again).
Good to know
- A graph does not run code and cannot read or write files: tools that import, export or open projects are not offered as nodes.
- A graph is evaluated for at most 5 seconds and runs at most 2,000 commands at once; a list holds at most 10,000 items.
- In a shared session, graphs are the host's, like scripts: a guest cannot open, preview, bake, rename or delete them; their Graphs panel says so.